Population geography

The study of human populations is known as demography. A population must be measured in order to study the characteristics of people. In other words, we need to count people and measure attributes of them to practice demography. There are two main ways of counting people. First, demographers can complete a census, where every person in a geographical area is counted. Second is a sample, in which a randomly selected subset of people are measured to estimate a whole population. As strange as it sounds, a census is can be less accurate than a sample. As the population to measure gets larger, there are several factors that make getting an accurate census with great depth of data. When censusing a population, the number of questions must be reduced, and often the answers are simplified only to Likert scale or multiple choice style questions, whereas samples can have longer form questions and full interviews. A census is also expensive and burdensome for data collection, whereas samples are cheaper and can be deployed more frequently, allowing change to be measured more rapidly. Lastly, a census can be less accurate because it is hard to find and count 100% of the population.
Let’s build on that last idea by looking at the United States Census and examine some excerpts from the Constitution. The US has a decennial census mandated by the Constitution in Article I, Section 2, Clause 3:
Representatives and direct Taxes shall be apportioned among the several States which may be included within this Union, according to their respective Numbers, which shall be determined by adding to the whole Number of free Persons, including those bound to Service for a Term of Years, and excluding Indians not taxed, three fifths of all other Persons. The actual Enumeration shall be made within three Years after the first Meeting of the Congress of the United States, and within every subsequent Term of ten Years, in such Manner as they shall by Law direct.
This clause sets up the census to be completed every ten years. It also includes the infamous Three-Fifths Compromise; enslaved peoples were counted, but only as 3/5 of a person for apportionment purposes. This clause was subsequently changed in the 14th Amendment, Section 2:
Representatives shall be apportioned among the several States according to their respective numbers, counting the whole number of persons in each State, excluding Indians not taxed.
Note that with the 14th Amendment, following the original language of Article I, states that the US is to count the “whole number of persons in each State.” It does not state to only count citizens, or only count people that live in homes with well-defined addresses. Both of these populations are to be counted as part of the US Census, but both can be difficult to count subpopulations. In some cases, noncitizens may not want to have their whereabouts or information be known to the federal government, especially if they are undocumented. The homeless are themselves difficult to find and count with 100% accuracy.
As such, often censuses will undercount. However, a well-defined sample will be able to estimate values, sometimes to a greater degree of accuracy, through statistical inference and interpolation. The US Census Bureau samples frequently. One of the most well-known is the American Community Survey, which provides yearly estimates for a wide range of demographic attributes. Geographically, values estimated for larger areas, like states, will have more accuracy by having a larger sample. Smaller geographical entities, like counties, cities, and census tracts, will have more variability and sometimes need to combine 3 or 5 years worth of samples to get a solid estimate.
Exercise: Census & ACS data
If you are interested in exploring Census and ACS data, go to https://data.census.gov/cedsci/. There are guided interfaces on how to view and download data for a variety of geographical scales.
Density and population ratios
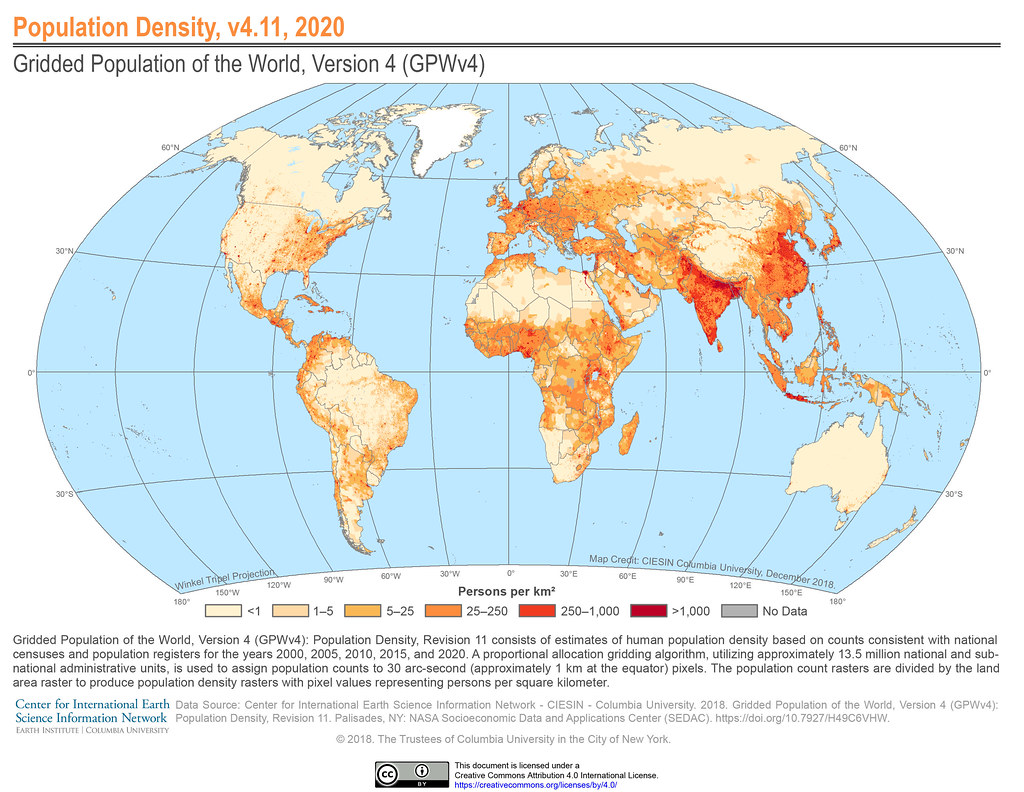
Geographers are interested in how populations are distributed spatially. It may not be good enough to say how many people are in a particular area, but instead, it should be normalized by some other factor. If two countries have the same population, but one is twice as big as the other in physical area, the populations will be distributed in different ways. For this situation, geographers use density. Population density is the number of people in an area divided by the total land area. Another way of thinking about density is physiological density, which is the number of people in an area divided by the amount of land under cultivation. This gives an idea of the amount of arable land being used to support a population.
Beyond area-based densities, demographers will normalize the size of different subpopulations by dividing by the total population; in other words, creating ratios or percentages. These can then be compared from location to location. For example, chances are that New York City, being the most populous city in the United States, will have the largest raw numbers for any particular demographic (race, age group, or multitudes of other population breakdowns). But, new patterns may emerge in seeing if these demographics are comparatively large or small as a percentage.


One common method of studying population is by looking at the distribution of people’s ages within a location. Visually this is done through population pyramids, which give a window into the age-based composition of a population as opposed to the geographical distribution. This horizontal bar graph separates males and females and breaks each into smaller cohorts. Cohorts are groups of people who share a common temporal experience. Your graduation year sets you in a certain cohort with others that graduate at the same time. Likewise, those that are born in the same time period is a cohort. In population pyramids, cohorts are generally grouped into 5-year intervals. The shape of the pyramids are generally categorized as expansive, stationary, or constrictive. Expansive locations have a wide base and are experiencing high population growth. Stationary locations have a base close to the size of other cohorts, meaning they are either slowly growing or not growing. Constrictive locations have a narrow base, showing population decline. Note that these categories are generally applied to countries; when looking at smaller geographies like cities, the same patterns don’t tend to exist. People commonly move in and out of cities, but are much less likely to leave a country. That means that classic college towns will always have a large cohort of people from about age 20 – 30; older people move out, and younger people keep moving in, rather than a cohort aging through the location.
Exercise: Explore Population Pyramids
Go to https://www.populationpyramid.net/world/2019/. There you can use the pull down menu to see current population pyramids for the world, continents, regions, or individual countries. There is also the ability to see population pyramids in the past. Look at a few; can you find:
- Examples of countries that are expansive, stationary, and constrictive?
- What continent is experiencing the fastest growth? The slowest?
- How the US population pyramid has changed over time?
Looking at broader cohorts can be illustrative of patterns of population, especially as your geography gets smaller. Counties and cities look at three broad cohorts:
- Youth cohort: population under age 15
- Middle cohort: population between 15 and 64
- Old-age cohort: population 65 and older
The middle cohort is generally seen as the population that is economically productive. The youth and old-age cohorts are generally aged too young or too old to be a part of the labor market. These are of course quite broad comparisons and are not looking at the employment status of every single person. If the youth and old-age cohorts are combined, and divided by the size of the middle cohort, a dependency ratio is calculated. This calculates a ratio of the economically unproductive to the economically productive. Higher ratios mean that there are fewer workers supporting larger numbers of people, which can hurt economic sustainability.
Exercise: Thinking About Cohorts
Imagine that you are an urban planner, or someone working in a city government. You see the sizes of the youth, middle, and old-age cohorts. What sort of implications are there under the following scenarios? In other words, what infrastructure or policies will you explore in these situations?
- The youth cohort is relatively large
- The middle cohort is relatively large
- The old-age cohort is relatively large
Birth rates
How populations change is described with a fairly simple equation:
Population = Previous Population + Births – Deaths + Immigration – Emigration
The next section will discuss migration. This part outlines natural changes to the population; namely births and deaths. While total numbers of births and deaths are what will change the population, demographers often look at crude rates. The crude birth rate is the total number of births in a given time period per 1,000 people in a population. The crude death rate is the same but for deaths. A narrower slice at looking at natural increases is to understand the total fertility rate (TFR). This is the average number of children born by females aged 15-49, which is the age range typically tied to reproduction. Demographers look at a TFR of 2.1; if TFR falls below this number, there will be a natural decline in population as not enough births are happening for replacement rate. According to the CIA World Factbook, the country with the highest total fertility rate is Niger at 6.49. The United States has the 143rd highest value at 1.87. Why isn’t the United States population decreasing?
Migration
Migration is the other way that populations change. Migration is split between emigration (moves from a place) and immigration (moves to another place). A trick to remember this distinction is that you Exit when you Emigrate and you come In when you are an Immigrant. The difference is whether you are talking about people coming or going from a particular location.
Other ways to categorize migration are by distance and choice. Physical and social distances are different between international and internal migration. International migration is from one country to another, while internal migration is moving from one part of a country to another part. Voluntary and forced migration is about the migrant’s choice; clearly voluntary migration is based on an individual’s choice while forced migration is against an individual’s will.
Examples of combining categories of migration
| International voluntary migration
European migration to the United States, from colonial times through especially the early 1900’s was largely voluntary. Reasons for migration were varied (religious freedom, economic opportunities, and more). Asian and Latin American migration to the United States has likewise been largely voluntary. International voluntary migration can be temporary; perhaps after earning an education or enough money, people may return to their native countries. |
Internal voluntary migration
The Great Migration of African Americans from the rural South to the industrial North occurred in waves from 1910 to 1970. Large scale agricultural mechanization led to less need for workers on southern farms, while at the same time massive industrialization in northern cities called for new migrant workers. This was a massive population shift as African Americans were more concentrated in the South. |
| International forced migration
The transatlantic slave trade is an example of international forced migration. People from West Africa were forcibly taken from their homes, packed tightly into ships, and sold into slavery onto forced labor camps called plantations in the New World. This is still classified as migration, which is just about if movement occurred, but was clearly not done by individual choice from the migrants. |
Internal forced migration
The Trail of Tears is perhaps the best known American example of internal forced migration. The Cherokee Nation was forced to leave their treaty-protected homelands in Georgia for Oklahoma in the 1830’s. It is estimated that about a quarter of the 16,000 Cherokees died in the forced march to Oklahoma. |
Migration, especially internationally, is not as easy as just wanting to leave a place or wanting to go to a place. Often there are barriers to movement. Absorbing barriers are those that completely block movement, whereas permeable barriers are those that weaken movement but still allow some diffusion. These barriers can be physical or social. A physical barrier may be an ocean, whereas social barriers may be walls, passports, and quota policies. The Berlin Wall, for example, was a social policy to separate democratic West Berlin from Communist East Berlin. This barrier was fairly permeable for West Berliners, who were free to enter East Berlin, but essentially an absorbing barrier in the other direction for East Berliners.
Race and ethnicity
One common demographic distinction to observe is that of race and ethnicity. Race and ethnicity is an identity in a culture that shapes the opportunities and disadvantages people may see in a society. As you will read about in the link below, race is something that does exist in humanity in the social sense, but not the biological sense. In other words, race is real because people think its real. Ethnicity, again as you will read below, is at times used as an euphemism for race but is a separate concept.
Though race and ethnicity are enforced strongly by society, there is also a significant individual component. One can see the competition between the individual and the society in looking at historical Census forms where people answer to their racial or ethnic identities. The Census Bureau has a database showing census forms from each decennial census. Early on, these forms were completed by Census employees who themselves could designate a person’s race. Later forms allow for individuals to fill out and return forms, answering the questions themselves. But, there is still the battle between individual and social definitions when looking at the terminology used for race. View the 2010 Census form; there is an entry for “Black, African Am., or Negro.” In 2010, this entry was controversial due to the inclusion of the anachronistic term “negro.” The argument was that some individuals, raised in a bygone era, still self identify as negro. Again, this was controversial. In looking at the more recent 2020 Census form, the category has been shortened to “Black or African American.” Ethnicity, of which the US Census Bureau only defines as Latino/a origin, is a separate question from race.

As described in the above chapter, one of the primary geographical connections with race is residential segregation. This pattern is clearly demonstrated by looking at the Racial Dot Map created by ESRI using 2020 census data based on the original map created by the Weldon Cooper Center for Public Service at the University of Virginia using 2010 census data. In the interactive map linked above, there is one dot on the map for every 12 people in the United States as of the 2020 Census. As a dot density map, the dots are randomly placed within census blocks and colored based upon the racial identity of individuals. The screenshot image to the right shows the pattern of residential segregation in Baltimore, Maryland. The map shows the white population with blue dots and the black population with green dots. The 2010 data (pictured to the right) still shows the classic “Black butterfly” shape of residential segregation in Baltimore that has existed for decades.
Many cities in the United States have stark dividing lines between black and white neighborhoods. Of course, divisions between other racially-concentrated neighborhoods exist as well, but the history of residential segregation in the United States is largely a black/white phenomenon.
Exercise: Exploring the racial dot map
Many cities in the United States have stark dividing lines between black and white neighborhoods. It may simply be a street, with one side being predominantly white and the other predominately black. Of course, divisions between other racially-concentrated neighborhoods exist as well, but the history of residential segregation in the United States is largely a black/white phenomenon.
Go to http://racialdotmap.demographics.coopercenter.org/ and navigate to any city of your choice. Is there a dividing line (or lines) between segregated neighborhoods? What are the dividing lines? Explore some other cities; what spatial patterns of segregation can you see?
the study of human population
survey every person in a geographical area is counted
a randomly selected subset of people are measured to estimate a whole population
method to measure positive or negative response to a question
people who have legal recognition, protections, and rights within a sovereign state
sample completed by the US Census Bureau
number of people in an area divided by the total land area
the number of people in an area divided by the amount of land under cultivation
land able to be cultivated
people who study and practice demography
graphs that show distribution of population by age and sex
group of people who share particular attributes
ratio of the economically unproductive to the economically productive
total number of births in a given time period per 1,000 people in a population
total number of deaths in a given time period per 1,000 people in a population
average number of children born by females aged 15-49
moves from a place
moves to another place
across state borders
within state borders
factors which completely block movement
aspects that weaken movement but still allow some diffusion
